Free calculator
Free A/B test significance calculator: check your test result
This A/B test calculator tells marketers whether there's a real difference between two versions of a page, email or ad, or just random chance. Enter visitor and conversion counts for each to get both conversion rates, the relative uplift and a confidence figure, with a verdict saying if it clears 90% or 95%.
Free kit
Get the A/B testing template and significance calculator in Excel
The kit puts this A/B test significance calculator in Excel, with a test tracker, for marketers who want every result checked the same way and written down.
- Significance workbook
Five steps from raw counts to a verdict.
- Test tracker
Eleven columns, from prediction to next steps.
- Same maths
The same unpooled two-proportion z-test as this page.
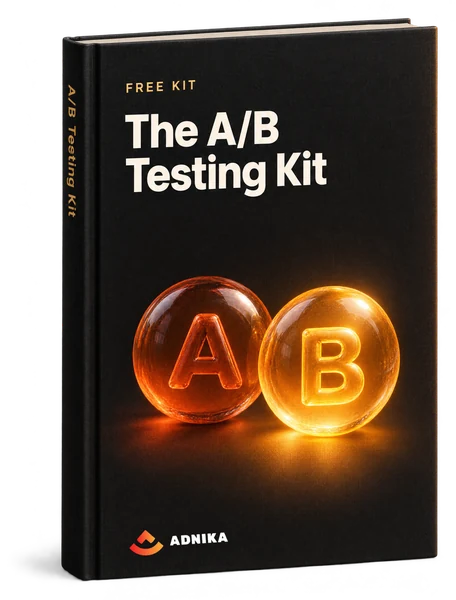
Get the A/B testing kit
Your kit is ready
The ZIP holds two Excel workbooks. In the calculator, type your numbers into the red cells and the rest fills in by itself.
Download A/B Testing KitA copy is on its way to your inbox too.
What's inside
Inside the kit: a statistical significance calculator and tracker
Steps 1 and 2: inputs, rates
Type each version's visitors and conversions into the red cells, and the sheet returns both rates with their standard error (how far a rate could drift by chance alone). Odd rates usually mean broken tracking.
Steps 3 and 4: intervals, pass marks
Step 3 sets a confidence interval round each rate at 90% and 95%, so you can see if the ranges are tight. Step 4 gives the z-score, a pass or fail at each level and a P-value cell that reads as confidence (higher is better).
Step 5: the verdict in words
A sentence for your report: which version converted better, by how much, and how sure the sheet is that the change will improve your conversion rate. Check the numbers above it first.
Test tracker: 11 columns
Landing page name, owner (the DRI, or directly responsible individual), status, test, start, end, prediction, result, statistically significant?, notes and next steps: one row per experiment. Six sample rows from 2017 show the format; clear them first.
How to use it
How to use the A/B test calculator and tracker
Write the row before launch
Add the page, owner, change and a prediction with a reason, as the sample rows do: B will win because the original subheader is more actionable. Then fix the end date from the sample size you need, not from your patience.
- One change per test
- End date in advance
Check the numbers at the end
When the planned sample is in, enter the counts and check the split before the verdict. If a 50/50 test sent 5,000 visitors to A and 4,300 to B, that's a sample ratio mismatch (SRM), so don't trust the result.
- Full sample first
- Then the split
Log the result and next step
Fill in the result, significance, notes and next-step columns, and put the numbers in Notes (both rates, the uplift, the confidence) rather than just 'B won'. That keeps the call defensible a year later, when nobody remembers running the test.
- Log flat tests too
- Name the next test
How it works
How to calculate statistical significance for an A/B test
How the A/B test significance calculator works
It runs an unpooled two-proportion z-test, the standard approach for comparing two proportions. Its null hypothesis is that A and B convert equally. The formula divides the gap between the rates by its standard error, giving a z-score, then reads it off the bell curve: how surprising are the observed results if nothing differs? It's a normal approximation of binomial data, so distrust small samples.
A/B testing example: 400 vs 460 conversions
Say it's a landing page headline test with the figures above. A converts 400 of 5,000 visitors (8.0%), B 460 (9.2%): in this example, a 15.0% relative lift, z of 2.14 and about 98.4% confidence, significant at 95%. If each version had 2,500 visitors at the same rates, confidence would drop to about 93.5%; at 1,000, to about 83.1%. Same lift, smaller sample, weaker verdict.
Read moreReading the result: p-value, confidence and direction
Confidence is one minus the one-sided p-value: the example's 98.4% means p of about 0.016, the chance of a gap this big if the null hypothesis were true. The calculator runs a one-sided test, a directional question: is the better version really better? A two-sided test asks if A and B differ significantly either way, which raises the bar for z from 1.645 to 1.96. Agree one-tailed or two-tailed before launch.
A/B test sample size and test duration
Set the required sample size before launch from your baseline conversion rate, the minimum detectable effect (MDE, the smallest lift worth finding) and statistical power, usually 80% (the chance of catching a real effect if there is one; missing it is a type II error). For example, an 8% baseline and a 15% relative MDE need about 6,750 visitors per variant (one-sided, 95%). Statista's 2025 data puts the average e-commerce conversion rate at under 2%; at 2%, the same lift needs roughly 29,000 per variant.
Mistakes that inflate false positives
Peeking is the worst. If you check daily and stop the first time it shows 95%, your false positive rate ends up far above 5%: the z-test assumes a fixed sample size, and random chance gets many tries. With many variants, one can win due to chance alone, so test one variant at a time or apply a Bonferroni correction (divide the significance threshold by the number of comparisons). And watch a guardrail metric, one that mustn't get worse, such as refunds.
A/B testing template: building a testing programme
HubSpot's 2026 State of Marketing report found that 50% of marketers use conversion rate optimisation (CRO), their second most-used optimisation technique, and that visual assets are what they test most. Without a log, the same image test gets rerun next year. Low-traffic B2B pages are harder: on a demo page with 400 visitors a month converting at 5%, for example, the visitors needed to detect a 10% lift come to about 49,000, roughly ten years. Test bolder changes there, or ask customers directly.
Read moreNeed a hand?
Where we can help with A/B testing
Rather hand testing over? It's the work we do at Adnika.
FAQ
Questions about statistical significance in A/B testing
Short answers to common questions.
It means the gap between versions is too big to blame on chance. The usual significance level (alpha level) is 0.05, a 95% confidence level: if the p-value falls below it, you reject the null hypothesis and the results are statistically significant. Size is separate; a tiny lift can be significant and not worth shipping.
The maths is exact; the answer is only as good as the test behind it. It holds if traffic was split at random, the sample size was fixed in advance and nobody stopped the test early.
An A/A test splits traffic between two variants that are identical, so a significant result should be rare. Keep getting winners? The set-up is broken: an uneven split, double-counted conversions or a tracking bug. Run one before trusting a new tool.
One sentence first: because we saw [evidence], we expect [change] to move [metric] for [audience]. Then the baseline rate, MDE, sample size per variant, end date and a decision rule. The hypothesis goes in the tracker's Prediction column.
Until it reaches the planned sample, in whole weeks (one at least, two is safer) so every weekday counts. Avoid unusual weeks, such as a big sale or Ramadan, unless that season is what you're testing.
Treat it as an answer: the change didn't move the metric enough to measure. Keep the simpler version, log the numbers and test something bolder. Don't crown the version that happened to be ahead; it hasn't earned it.
It depends on the channel. Email and marketing automation platforms usually build A/B testing in, Google Ads has experiments, Meta has an A/B test tool, and Optimizely or VWO handle websites (Google Optimize closed in 2023). Some report Bayesian probabilities, not frequentist confidence.
This calculator and the kit are free. The real costs are a testing tool (often bundled with email and ad platforms you already pay for), build time for each variant and traffic sent to a version that may lose.
No questions match — try another search.
More free templates
More free marketing templates
Testing is one part of the plan; these cover others.
 Template
Growth Strategy Template
A Word growth strategy template: rationale, primary and secondary targets, action plan, team, funding and tools, and a results table to report back on.Get the free template Template
Productivity Templates
An Excel workbook with a task prioritisation score, a team hours calculator and progress charts for keeping a project on track.Get the free template Template
Marketing Plan Template
A Word marketing plan template with a SWOT table, target market and personas, a marketing mix section, a budget table and a channel plan.Get the free template Template
Social Media Content Calendar
An Excel calendar for planning posts on X (Twitter), Facebook, LinkedIn, Instagram and Pinterest, with a monthly planner, a posting schedule and a content library.Get the free template
Free download
Take the A/B test significance calculator into Excel
One workbook calls each test, the other remembers it. Both are free.